Dashboard
The dashboard gives you a fast read on the latest run, how the test suite changed against its baseline, and where quality is moving over time.
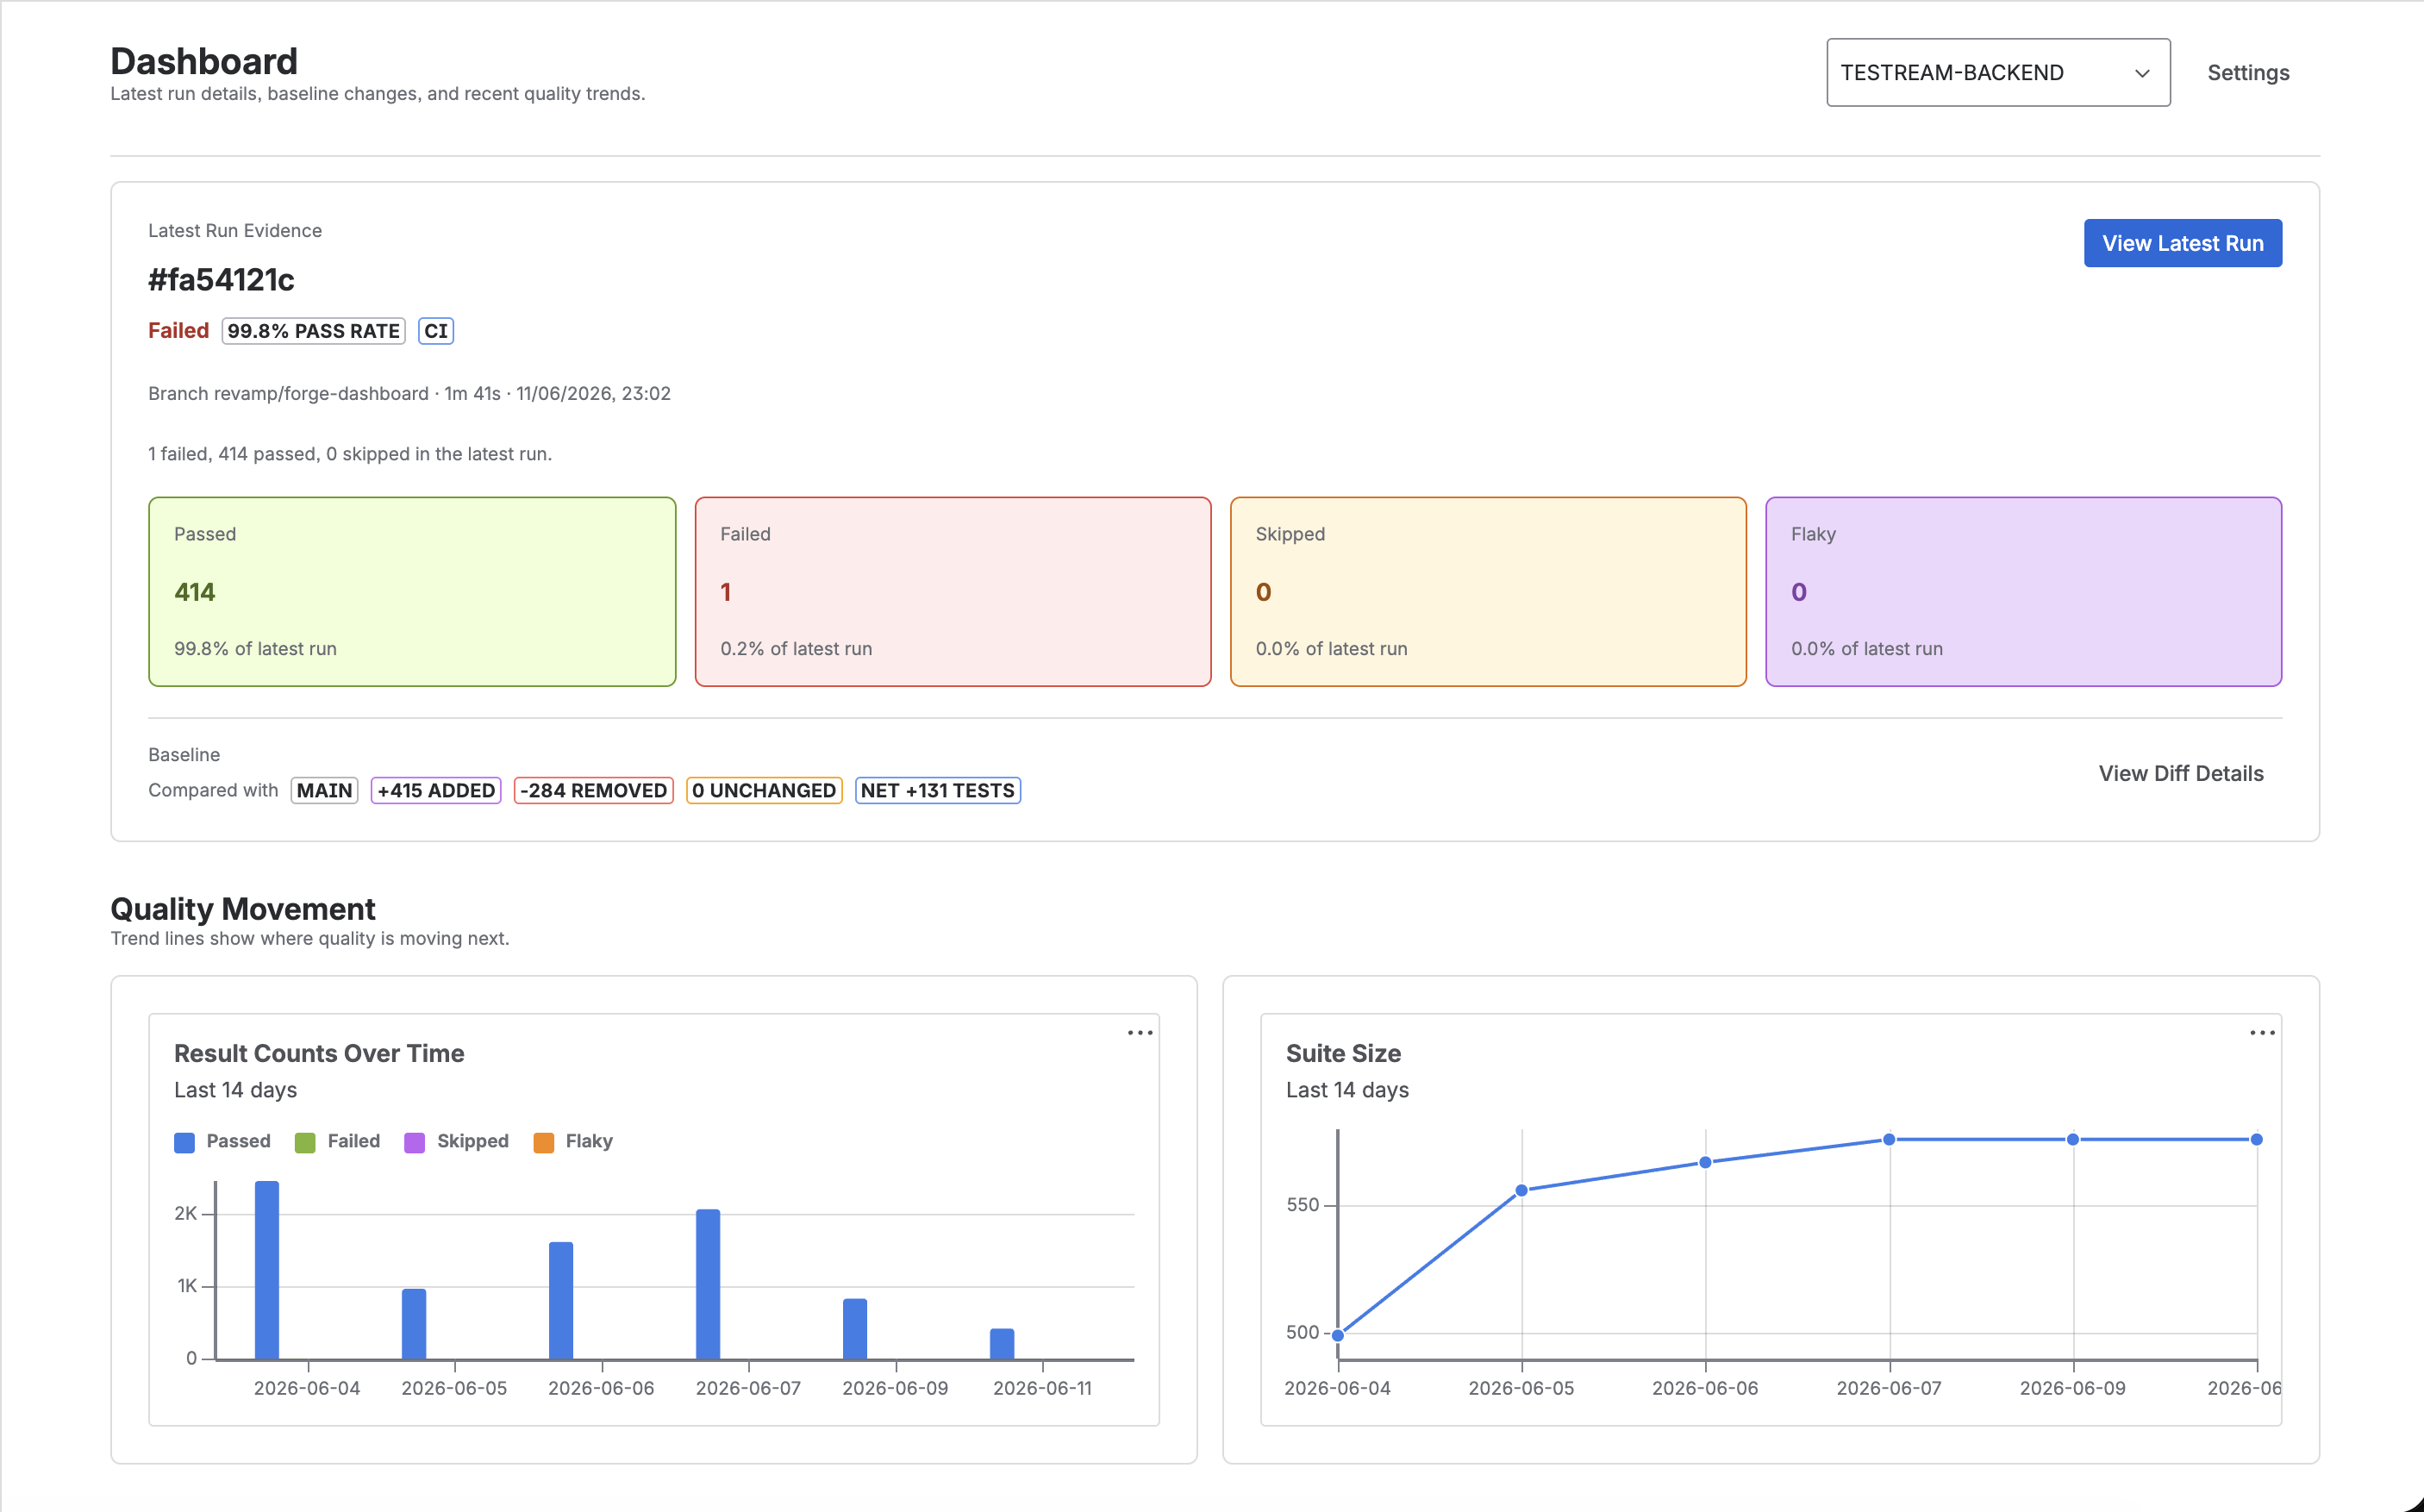
Header & Project Context
At the top of the page, the header keeps the project switcher and settings action compact so the main evidence stays in focus.
- Dashboard title - anchors the page
- Project selector - switch between connected test projects
- Settings - jump to project configuration quickly
Latest Run Evidence
The main evidence panel focuses on the newest run and surfaces the details that matter immediately:
- Run status and pass rate
- Branch, commit, duration, and timestamp
- Latest run result counts for Passed, Failed, Skipped, and Flaky tests
- A direct View Latest Run action for full run details
This keeps the dashboard factual and actionable without turning it into a wall of summary cards.
Baseline Comparison
The latest run panel also includes an inline baseline summary so you can see how the suite changed without leaving the dashboard.
Depending on the available comparison, you may see:
- Baseline branch or prior run context
- Tests added since baseline
- Tests removed since baseline
- Count of unchanged tests
- Net change in suite size
Use View Diff Details to open the full test suite changes modal.
Quality Movement
Below the hero panel, the dashboard charts show where quality is moving over the selected trend window.
Result Counts Over Time
A grouped bar chart showing daily test case counts for:
- Passed tests
- Failed tests
- Skipped tests
- Flaky tests
This chart now uses actual test counts rather than percentages so the movement is easier to interpret at a glance.
Suite Size
A line chart tracking total test count over time. Use it to spot suite growth, stalled coverage, or sudden drops.
Top Flaky Tests
When flaky tests exist in the selected window, a horizontal bar chart highlights the most unstable tests first.
Recent Test Runs
The bottom section keeps a short list of recent runs so you can continue scanning recent execution history without leaving the dashboard.
Each row surfaces:
- Test run timestamp
- Branch and environment context
- Pass/fail totals
- Release and View actions
Action Buttons
- View Latest Run - open the most recent run details
- View Diff Details - inspect suite changes in the full diff modal
- All Runs - open the complete run history
- Trends - open the dedicated historical trends page
- Releases - navigate to release-linked test runs
Next Steps
- Test Run Details to inspect one run in depth.
- Trends & Analytics to review historical quality movement.
- CI/CD test results in Jira for the product overview behind this workflow.